Ultrasound Simulink Module
Introduction
Signal Processing and Control in SIMULINK provides a programmable platform in SIMULINK that enables the student to visualize the entire signal chain of an ultrasound system. A lot of variability in expert opinion arises from the interpretation of anatomical structures in ultrasound images. Thus it is imperative in knowing the exact processing steps performed in ultrasound system. Staging each processing step as a specialized block breaks the complex signal processing task into more manageable tasks and allows the student to easily replace a block/component with a more advanced algorithm. Most vendors use various processing and filtering methods they do not reveal explicitly and thereby sell the ultrasound system as a set of black boxes which makes it difficult for the user to determine the filtering steps exacted in the B-mode creation. This environment facilitates the student to come up with an optimal set of parameters to obtain the B-mode image. We provide a starter kit in SIMULINK that is composed of the basic capabilities of the ultrasound front end (i.e. in the form of blocks in SIMULINK) such as Ultrasound image acquisition parameter calculation, FIR filter application, envelope detection and compression of intensity values. The SIMULINK framework provides easy customization of the blocks and we envision using more blocks with advanced capabilities like more choices for the A-line filter selection, time-gain compensation, scan conversion (for convex transducers), further B-mode post processing, 3D reconstruction of the post processed RF frames etc. You can also envision extending the signal chain right from the excitation of transducer elements, focusing and beam steering to obtain the RF data.
We achieve two objectives in this module:
a) Visualize and reconfigure the processing steps in a typical ultrasound system for the provided RF data.
b) Analyze the spectrum of the RF data by observing the time and frequency content in each A-line.

Fig. 1. Main Interface
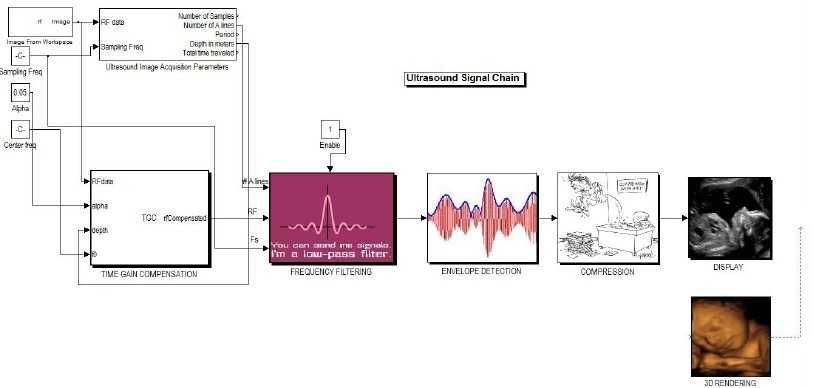
Fig. 2. Simulink Blocks
In figure 2, you can see the differenct blocks used to process RF signal:
FIR Filtering: The input to this block is the RF data. A set of 3 FIR filters is applied to each A-line in the image and then averaged to get the output image from the block. Three 16-tap FIR filters are set as the default.
Envelope Detection: This step detects the amplitude of each RF A-line signal.
Post-Processing Filters: Image processing filters can be applied to the envelope-detected RF data in this step. This step uses two dimensional filters (2D FIR) as opposed to one-dimensional filters for each A-line in the FIR filtering step.
Log Compression: This step involves the compression of the dynamic range (difference between the max. intensity value and min. intensity value of the image) to fit the resolution of the machine displaying the image and enhance the visual perception of many low resolution anatomical structures.
Ultrasound Image Acquisition Parameters: We do not factor this step into the B-mode image generation. This block is used to calculate the number of RF A-lines, samples, time period and depth of acquisition given the sampling frequency.
 |
Dr. Jim Ji
|
Dr. Jim Ji